The D.A.T.A Project
For this project we each picked a topic that we were interested in finding out about our other classmates. Then, we each thought of 5 questions and Nicole combined them all into a massive survey. We then spent a day each completing the survey online and when we were all done, we sorted out the information so that each of us had the answers to the questions we needed. We took the information we gained and created various graphs that we put on an 11x17 paper and decorated with our theme. I enjoyed this project, but I felt like it took a very long time to get all of the information.
My Topic: Birthdays
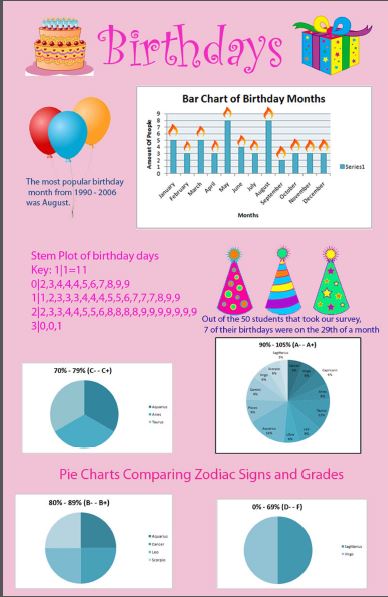
The topic I chose for this project was Birthdays. I was very interested in everyone's birthdays and zodiac signs. For my five questions, I asked: 1) When is your birthday? 2) What day were you born on? 3) What is your favorite day of the week? 4) What is your grade percentage in math/physics? 5) What is your zodiac sign? As you can see, I asked a variety of questions that gave me quantitative, qualitative and bivariate data. Ultimately, I ended up displaying a bar graph of birthday months, a stem and leaf plot of birthday days, and four pie charts comparing zodiac signs to grade percentage. You can see my Infographic by clicking on the file below.
| birthday_infographic.jpg |
What I Learned About My Peers
In creating my Infographic, I learned some interesting facts about my peers. First off, by looking at the bar graph I made to show my qualitative data, I learned that the most popular birthday months amongst my team are August and May. By looking at my stem and leaf plot that I made to display my quantitative data, I noticed that the most popular birthday day was the 29th. Lastly, by looking at my pie charts to show my bivariate data, I saw that most Taurus's have an A- - A+ which I found interesting.
